Here are some preliminary graphs produced from data logs taken from accelerating a tree in the harvester head. Pump RPM and as a result amount of oil flow are unknown.
First graph shows speed as a function of time:
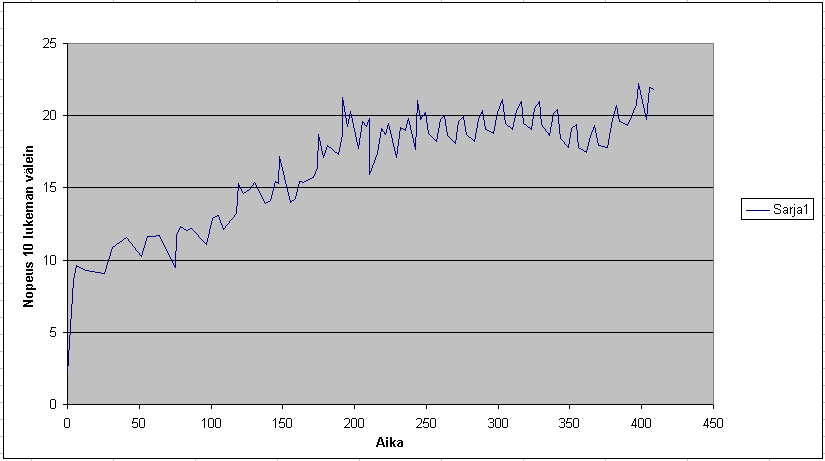
Forward feed has 3 valves in parallel and at the time of taking this capture the second valve was switched on around the 100 ms mark and third valve around 200 ms mark. The speed does seem to begin increasing after opening the second valve but after opening the third valve there isn’t clear indication of speed increase anymore. It’s possible that the oil flow was low enough that two valves were able to pass all the oil flow generated by the pump.
Second graph is speed as a function of position:
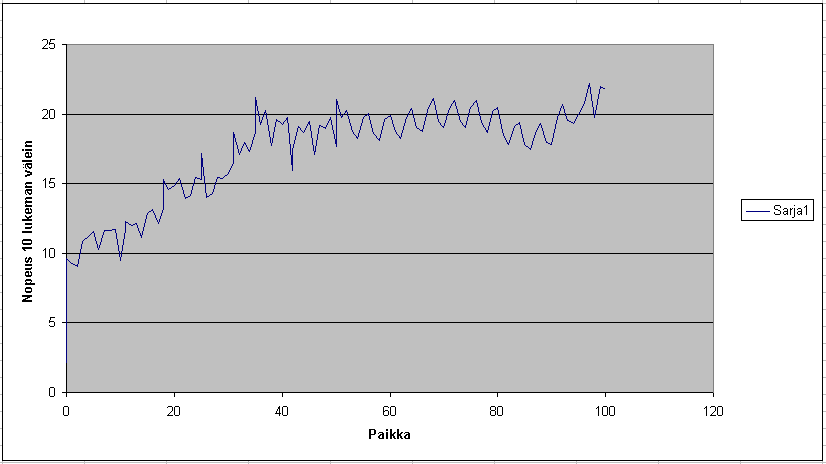
There is some jumping up and down in the above graphs and it’s not yet clear if that comes from the measurement process, the way the values are calculated or if the construction of the hydraulic motors itself causes this kind pulsating rotation.
Last we have position as a function of time:
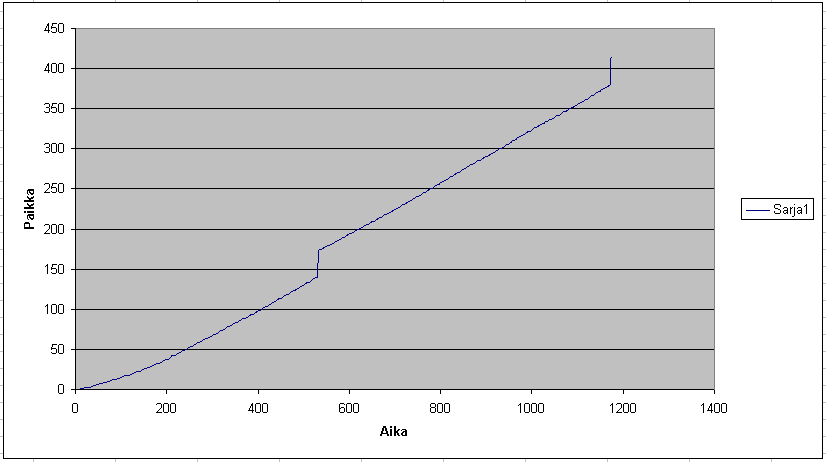
Here the couple big jumps are glitches in the logging process which was fixed and should be gone in the data logged next time.